Summary
BTC 24h outlook: range 75,610–78,240 (68% probability) without a clear direction. World: UST 10Y 4.894% and the dollar (DXY 101.79, +0.04% on the day) set tight financial conditions. Transmission to crypto runs mainly through: stock-market risk appetite, ETF flows (BTC), ETF flows (ETH); BTC correlation with Nasdaq 0.67, with DXY −0.05; BTC ETFs −711.3 $m over 5 days. Crypto assets: BTC 76,916 (−1.86% over 24h, daily range 76,520–78,430), 1 of 15 radar assets rose over the day.
Takeaway of the day
- Thesis: a 68% probability that BTC ends the day within 75,610–78,240 (±1.71%), no clear bias.
- Asymmetry: nearest liquidation clusters at +2.92% and −0.48% from price — closer below; the range itself is volatility-symmetric.
- Invalidation: an hourly close above 78,240 or below 75,610 puts the base case at risk and the view is reviewed (the forecast is scored on the hourly close at 08:00 MSK).
- What to watch: inside the range, breaks without volume tend to fail; an upside exit is confirmed by ETF inflows and stablecoin growth; a downside exit by wider credit spreads and a stronger dollar.
- This describes the market picture; it is not investment advice.
What changed since yesterday
- HY spread: +18.0 bp since the previous issue (now 3.44%).
- BTC ETFs: −398.6 $m on 11-02; 5-day sum −202.4 → −711.3 $m.
- Fear & Greed index: 37 → 26.
1. World: rates, dollar, liquidity
| Metric | Value | Δ day | Δ 5 sessions | As of |
|---|---|---|---|---|
| UST 10Y, % | 4.894 | −3.5 bp | −9.2 bp | close Nov 2, Yahoo |
| UST 2Y, % | 4.560 | −5.0 bp | −13.0 bp | Oct 30, FRED |
| 10Y−2Y spread, bp | 33 | — | — | Oct 30, calc. |
| 10Y real yield (TIPS), % | 2.60 | −3.0 bp | −6.0 bp | Oct 30, FRED |
| DXY | 101.79 | +0.04% | −0.52% | Nov 3, Yahoo |
| USDJPY | 157.91 | +0.15% | +0.24% | Nov 3, Yahoo |
| EURUSD | 1.1192 | +0.31% | +0.16% | Nov 3, Yahoo |
| Fed net liquidity, $bn | 5,746 | — | −56 $bn/wk | Oct 28, FRED (WALCL−TGA−RRP) |
| HY spread (OAS), % | 3.44 | +18.0 bp | +6.0 bp | Oct 30, FRED |
| S&P 500 | 7,541.40 | −0.51% | −1.76% | Nov 2, Yahoo |
| Nasdaq Composite | 25,164.36 | −1.07% | −3.84% | Nov 2, Yahoo |
| VIX | 21.15 | +1.7 pts | +2.8 pts | Nov 2, Yahoo |
| Gold, $/oz | 3,933.00 | — | −3.48% | Nov 3, Yahoo |
| WTI crude, $ | 97.04 | — | −2.86% | Nov 3, Yahoo |
| Brent crude, $ | 105.22 | — | −7.60% | Nov 3, Yahoo |
| Copper, $/lb | 6.44 | −1.60% | −2.77% | Nov 3, Yahoo |
| Nikkei 225 | 63,081.86 | −0.33% | +1.43% | Nov 2, Yahoo |
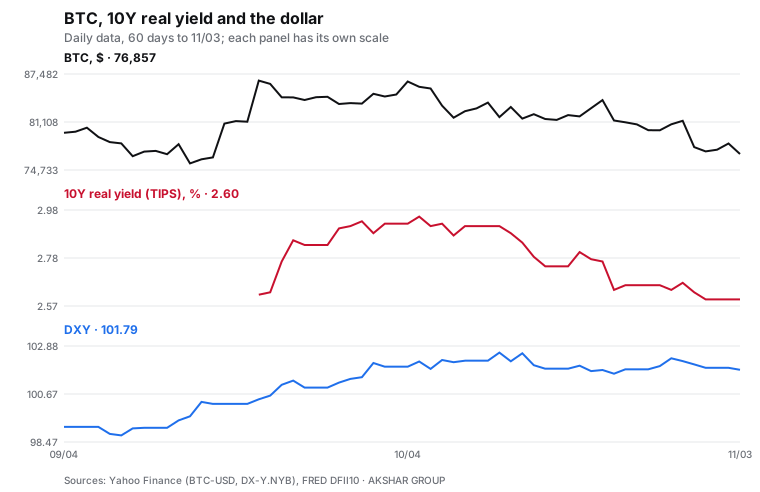
- Rates: UST 10Y 4.894%, 2Y 4.560%, 10Y−2Y curve 33 bp; 10Y −9.2 bp over 5 sessions. Real yield 2.60% (Oct 30).
- Dollar: DXY 101.79 (+0.04% on the day, −0.52% over 5 sessions), USDJPY 157.91.
- Liquidity: Fed net liquidity $5,746bn as of Oct 28 (−56 $bn over the week). HY credit spread 3.44% (+6 bp over 5 days, Oct 30).
- Stocks and volatility: S&P 500 7,541.40 (−1.76% over 5 sessions, Nov 2), Nasdaq Composite 25,164.36 (−3.84% over 5 sessions, Nov 2), VIX 21.15 (+2.76 pts over 5 sessions, Nov 2). Stock volatility is moderate.
- Commodities: Gold 3,933.00 (−3.48% over 5 sessions), WTI crude 97.04 (−2.86% over 5 sessions), Brent crude 105.22 (−7.60% over 5 sessions).
- Where money is going (5 sessions): leaders — Germany +2.2%, Japan +1.4%, dollar −0.5%; laggards — Nasdaq −3.8%, ether −4.4%, bitcoin −5.4%.
2. Transmission to crypto
| Channel | Metric | Value |
|---|---|---|
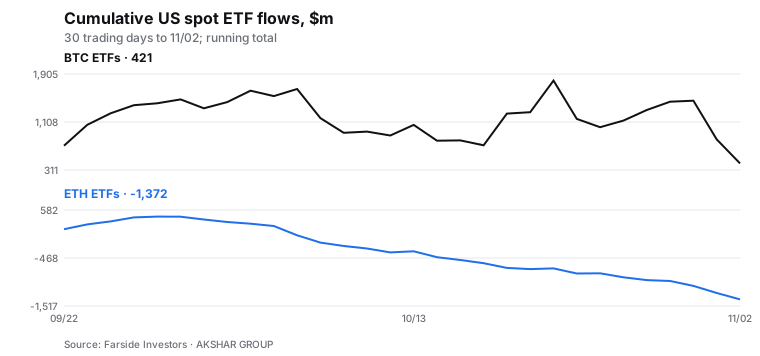
| Institutional demand | BTC ETFs | −398.6 $m (Nov 2); 5d −711.3; 20d −1,117.3 |
| Institutional demand | ETH ETFs | −139.7 $m (Nov 2); 5d −482.5; 20d −1,603.3 |
| Crypto liquidity | Stablecoins | n/a |
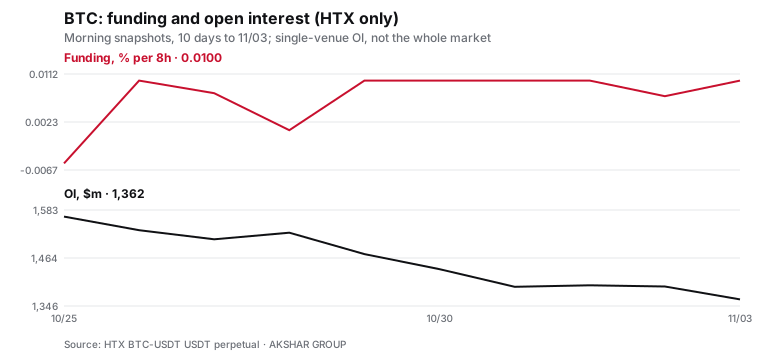
| Leverage (HTX only) | BTC: funding / OI | +0.0100% / 8h; OI 1,362 $m (−2.3% on the day) |
| Leverage (HTX only) | ETH: funding / OI | +0.0100% / 8h; OI 91 $m (−38.2% on the day) |
| 30d correlations | BTC vs Nasdaq / DXY / gold / ΔUS10Y | +0.67 / −0.05 / +0.38 / +0.10 |
| Sentiment | Fear & Greed index | 26 (fear, Nov 3) |
- BTC correlations over 30 trading days (daily returns): with Nasdaq +0.67, with DXY −0.05, with gold +0.38, with the change in the 10Y yield +0.10. The link with stocks is significant — BTC trades as a high-beta risk asset; the daily link with the dollar is currently weak.
- US spot BTC ETFs: −398.6 $m on Nov 2, −711.3 $m over 5 days, −1,117.3 $m over 20 days.
- US spot ETH ETFs: −139.7 $m on Nov 2, −482.5 $m over 5 days, −1,603.3 $m over 20 days.
- HTX derivatives — BTC: funding +0.0100% / 8h, OI 1,362 $m (−2.3% on the day); ETH: funding +0.0100% / 8h, OI 91 $m (−38.2% on the day); SOL: funding +0.0100% / 8h, OI 139 $m (−3.2% on the day). Funding is near neutral: the move does not rely on aggressive leverage.
- Fear & Greed index: 26 (fear), −22 over the week.
Dominant channels today: stock-market risk appetite, ETF flows (BTC), ETF flows (ETH).
3. Crypto assets
Regime: Neutral: no pronounced market direction.
- Regime: of 15 radar crypto assets, 0 are in an uptrend, 11 in a downtrend, the rest are range-bound; 1 show compressed volatility. Compression without a trend usually precedes a directional break — the direction will be set by the external impulse (rates, the dollar, flows).
- Breadth: 1 of 15 rose over 24h; 4 of 14 altcoins outperformed BTC.
- Rotation: BTC dominance 59.96% (+0.01 pp on the day), ETH/BTC +1.14% over 7 days. No material rotation between BTC and altcoins.
- Relative strength vs BTC over 7 days: leaders — PEPE +12.2 pp, HYPE +11.4 pp, LINK +1.6 pp; laggards — SOL −4.4 pp, ADA −4.2 pp, ZEC −3.3 pp.
- Consortium commentary: Consortium macro regime: mixed. 24h macro scenarios: risk-off strengthens 45%; risk-on continues 20%. No hourly direction call: the model's Brier score is 0.251 (≥ 0.25 — no better than chance).
| Instrument | Price | 24h | 7d vs BTC | Trend · stretch | Volatility | Support / resistance | 24h range | Radar signal |
|---|---|---|---|---|---|---|---|---|
| BTC Bitcoin | 76,916 | −1.86% | — | ▼ down ●●○ | normal | 76,520 / 78,430 | 76,520–78,430 | none |
| ETH Ethereum | 2,256.2 | −1.56% | +1.1 pp | ◆ range ○○○ | normal | 2,236.1 / 2,303.6 | 2,236.1–2,303.6 | none |
| SOL Solana | 92.220 | −2.84% | −4.4 pp | ▼ down ●●○ | normal | 90.790 / 95.110 | 90.790–95.110 | none |
| DOGE Dogecoin | 0.0742 | −2.27% | −0.8 pp | ▼ down ●●○ | normal | 0.0731 / 0.0761 | 0.0731–0.0761 | none |
| XRP XRP | 1.253 | −0.05% | +0.1 pp | ◆ range ○○○ | normal | 1.234 / 1.263 | 1.234–1.263 | none |
| BNB BNB | 696.92 | −2.04% | −1.9 pp | ▼ down ●●○ | normal | 693.47 / 711.90 | 693.47–711.90 | none |
| HYPE Hyperliquid | 83.656 | −4.94% | +11.4 pp | ▼ down ●○○ | normal | 82.602 / 88.018 | 82.602–88.018 | none |
| ZEC Zcash | 1,136.9 | −11.16% | −3.3 pp | ▼ down ●●○ | high | 1,125.8 / 1,280.0 | 1,125.8–1,280.0 | none |
| ADA Cardano | 0.1882 | −2.18% | −4.2 pp | ▼ down ●●○ | normal | 0.1860 / 0.1928 | 0.1860–0.1928 | none |
| LTC Litecoin | 53.880 | −3.49% | −1.1 pp | ▼ down ●●○ | normal | 53.440 / 55.880 | 53.440–55.880 | none |
| SUI Sui | 0.8691 | −3.30% | −0.8 pp | ▼ down ●●○ | normal | 0.8605 / 0.8999 | 0.8605–0.8999 | none |
| FIL Filecoin | 0.8685 | −0.38% | +0.6 pp | ◆ range ○○○ | compressed | 0.8508 / 0.8776 | 0.8508–0.8776 | none |
| TRX TRON | 0.3204 | +1.98% | +1.0 pp | ◆ range ○○○ | normal | 0.3134 / 0.3214 | 0.3134–0.3214 | none |
| PEPE Pepe | 0.0₅4698 | −4.57% | +12.2 pp | ▼ down ●○○ | normal | 0.0₅4594 / 0.0₅4934 | 0.0₅4594–0.0₅4934 | none |
| LINK Chainlink | 11.128 | −1.86% | +1.6 pp | ▼ down ●●○ | normal | 10.989 / 11.423 | 10.989–11.423 | none |
| XAU Gold | 3,934.0 | +0.63% | — | ◆ range ○○○ | normal | 3,900.6 / 3,978.9 | 3,900.6–3,978.9 | none |
| USOIL WTI crude | 97.150 | −3.68% | — | ▼ down ●●○ | normal | 95.270 / 101.11 | 95.270–101.11 | none |
| BRENTOIL Brent crude | 105.35 | −4.29% | — | ▼ down ●●● | high | 103.41 / 110.55 | 103.41–110.55 | none |
Price snapshot: 08:40 MSK (05:40 UTC), public HTX quotes. Trend — price position relative to EMA50/EMA200 on the hourly chart; dots — how far price has moved from EMA200, in ATR. This describes the current state; it is not a forecast or a signal. Levels — largest order-book clusters within ±4% and 24-hour extremes. “7d vs BTC” — 7-day return difference vs BTC.
4. Scenarios
Base case. Range trading: BTC within 75,610–78,240 (68% probability); no directional impulse from macro or flows.
Alternative case. A BTC break above the upper bound of the 68% range on rising volume. The most likely trigger is lower yields and a weaker dollar after macro data; confirmation would be renewed spot ETF inflows and growth in stablecoin market cap.
What would change our view:
- DXY: a reversal below the previous close would ease some pressure; now 101.79 (+0.04%).
- Spot BTC ETF flows: a sign change in the 5-day sum (now −711.3 $m) would change the assessment of institutional demand.
Catalysts — today and next 24h:
- No major scheduled events.
Risks of the day:
- The BTC liquidation cluster near 78,965 (+2.92% from price) may act as a price magnet.
- The BTC liquidation cluster near 76,354 (−0.48% from price) may act as a price magnet.
- The ETH liquidation cluster near 2,328 (+3.40% from price) may act as a price magnet.
- The ETH liquidation cluster near 2,233 (−0.82% from price) may act as a price magnet.
5. Verification: forecast track record
Published: 18 · Checked: 17 · Correct: 14
The hit rate will appear after 20 checked statements. Only statements from public issues count (since October 5, 2026); each is recorded at publication with a condition, deadline and data source and checked automatically against public HTX prices and FRED data, with no cherry-picking or manual edits.
- ✅ Direction: BTC will close the hour ending 08:00 MSK on Oct 30 below the issue price 80,218 (market-regime bias).
- ✅ BTC will close the hour ending 08:00 MSK on Oct 31 within 76,840–79,630 (±1σ of daily volatility, stated probability 68%).
- ✅ BTC will close the hour ending 08:00 MSK on Nov 1 within 75,760–78,540 (±1σ of daily volatility, stated probability 68%).
- ✅ BTC will close the hour ending 08:00 MSK on Nov 2 within 76,390–79,140 (±1σ of daily volatility, stated probability 68%).
- ❌ BTC will close the hour ending 08:00 MSK on Nov 3 within 77,010–79,760 (±1σ of daily volatility, stated probability 68%).
Retro run of the 68% method (computed after the fact, not in the main count): checked 17, correct 12; 68% range: 9 of 11; direction: 3 of 6.
Verifiable statements in this issue
- BTC will close the hour ending 08:00 MSK on Nov 4 within 75,610–78,240 (±1σ of daily volatility, stated probability 68%). Checked against: HTX USDT perpetual BTC-USDT, hourly candles (close).
This material is for information and research purposes only and does not constitute individual investment advice, an offer or a solicitation to trade. Trading crypto assets, commodities and leveraged instruments involves high risk, including the total loss of funds. Past results and forecasts do not guarantee future returns. You make your own decisions.
Sources: public market data — HTX, OKX, CoinMarketCap, FRED, Yahoo Finance, CNBC, DefiLlama, Farside (spot ETF flows), alternative.me; economic calendar. The issue is assembled automatically from the conclusions of the AKSHAR GROUP AI research consortium (macro, crypto, risk; forecast quality is checked by the Auditor) and market data; all figures are as of the snapshot, “n/a” means no verified source.
Archive
- November 3, 2026currentBTC 24h outlook: range 75,610–78,240 (68% probability) without a clear direction.
- November 2, 2026BTC 24h outlook: range 77,010–79,760 (68% probability) without a clear direction.
- November 1, 2026BTC 24h outlook: range 76,390–79,140 (68% probability) without a clear direction.
- October 31, 2026BTC 24h outlook: range 75,760–78,540 (68% probability) without a clear direction.
- October 30, 2026BTC 24h outlook: range 76,840–79,630 (68% probability) without a clear direction.
- October 29, 2026BTC 24h outlook: consolidation with a downside bias.
- October 28, 2026BTC 24h outlook: consolidation with a downside bias.
- October 27, 2026BTC 24h outlook: consolidation with a downside bias.
- October 26, 2026BTC 24h outlook: consolidation with a downside bias.
- October 25, 2026BTC 24h outlook: range 79,550–82,270 (68% probability) without a clear direction.
- October 23, 2026BTC 24h outlook: range 80,210–82,930 (68% probability) without a clear direction.
- October 22, 2026BTC 24h outlook: range 81,520–84,280 (68% probability) without a clear direction.
- October 21, 2026BTC 24h outlook: range 81,273–83,437 without a clear direction.
- October 20, 2026BTC 24h outlook: consolidation with a downside bias.
- October 19, 2026BTC 24h outlook: range 80,621–82,846 without a clear direction.
- October 18, 2026BTC 24h outlook: range 80,755–82,050 without a clear direction.
- October 17, 2026BTC 24h outlook: range 80,771–82,898 without a clear direction.
- October 14, 2026Forecast for the day: consolidation with a downside bias.
- October 13, 2026Forecast for the day: range 80,961–84,348 without a clear direction.
- October 12, 2026Forecast for the day: range 82,907–84,178 without a clear direction.
- October 11, 2026Forecast for the day: consolidation with a downside bias.
- October 9, 2026Forecast for the day: consolidation with a downside bias.
- October 8, 2026Forecast for the day: consolidation with a downside bias.
- October 7, 2026Forecast for the day: consolidation with a downside bias.
- October 6, 2026Forecast for the day: consolidation with a downside bias, with BTC failing to settle above 87,200.
- October 5, 2026Forecast for the day: consolidation with a downside bias, with BTC failing to settle above 86,964.
- October 4, 2026Forecast for the day: consolidation with a downside bias.